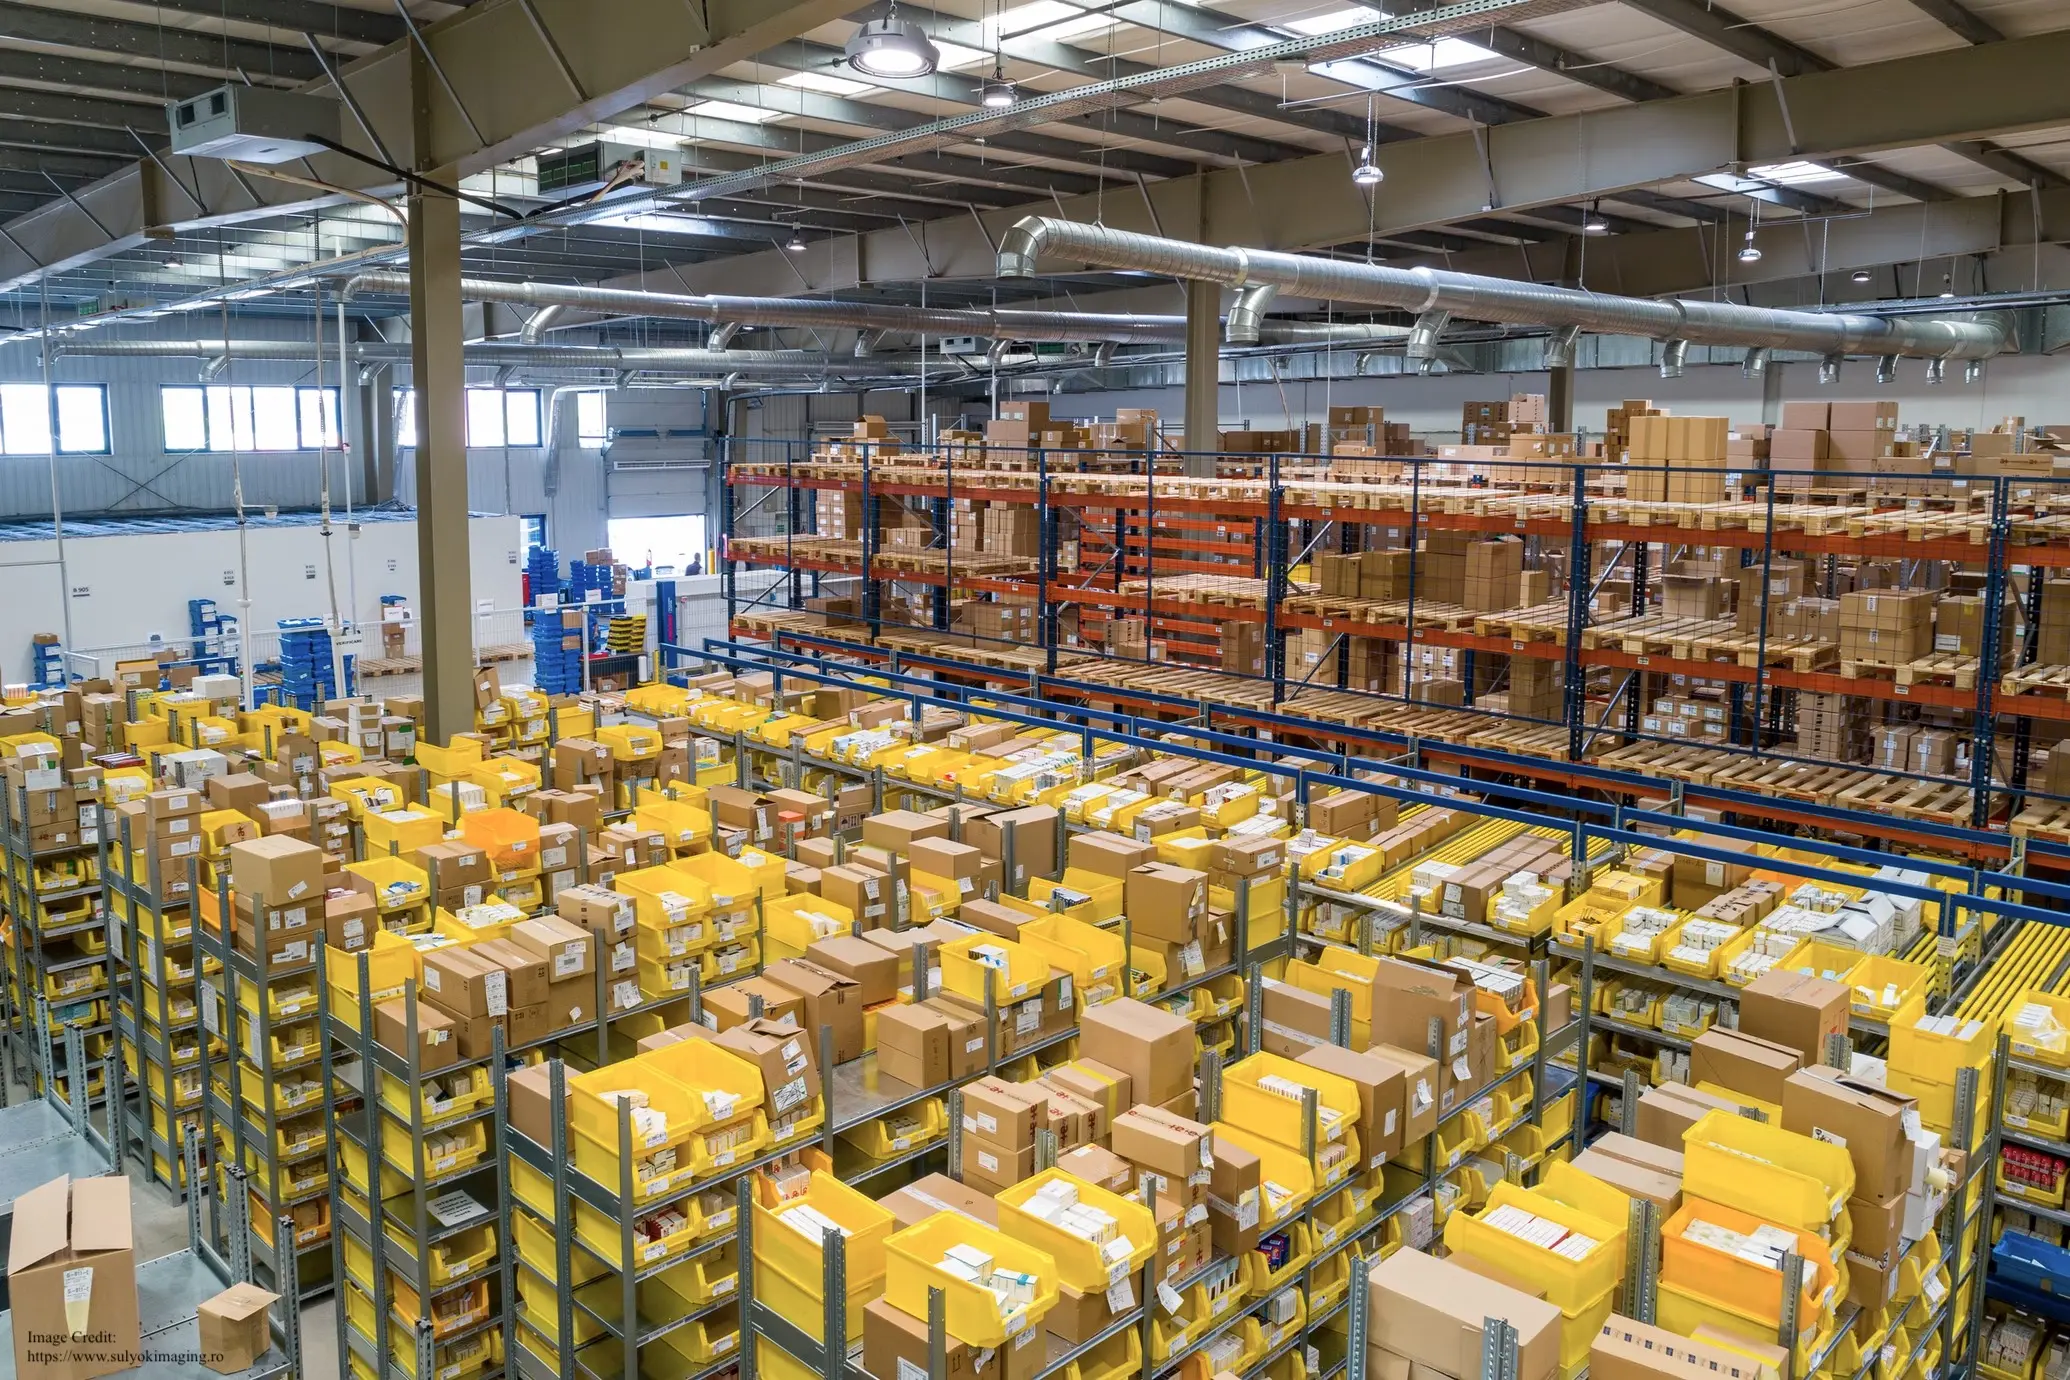
Optimize inventory for more profits

Use BoostKPI to be on top of inventory trends even when markets are volatile and customer behaviors change quickly. Discover trends in real-time.
There is no shortage of flashing news these days (CNBC article) about how retail behemoths such as Target, Walmart, Gap, American Eagle, and others are falling short of their projected profits – all because their inventory projections failed to meet market demand. Now, the industry is aggressively and prudently attempting to make room for a more relevant and in-demand spread of SKUs – or what they believe is an in-demand spread…
Listen, having an optimal inventory projection is like having a crystal ball, which every retailer wishes for, but in its absence, we rely on the next best thing in line: historical events, category experts, market projections, biases, gut instincts, and whatever else is in style! However, events in recent years have thrown much of the domain knowledge out the window, leaving many of these retailers grappling with dead stock on the floor that is no longer relevant or active. How could anyone have prophesied that toilet paper would become the best-selling item on the shelf, or that every other house in the neighborhood would hold their own bake-a-thons, causing yeast and flour to fly out the door?
The point here is not that we can accurately predict our consumers’ spending habits in the aftermath of a pandemic, rising inflation, or high gas prices—all these events are beyond our control. The greater the number of SKUs, the more difficult it is to understand how each of these products/categories will perform in the face of unstable, shifting, and frequently volatile consumer behavior. What we can do is closely monitor and analyze our business KPIs at all granularities on a weekly, daily, and SKU-by-SKU basis. Only then will we be able to stay ahead of the curve before dead stock and poor inventory turnover deplete our profit targets. Companies use query-based analytics tools to provide insight, build fancy visualizations, and keep track of their KPIs, but constantly updating these queries to keep them relevant is not only a huge time sink, but also nearly impossible. Did I mention how inefficient this process can be in terms of both cost and time?
BoostKPI is the next generation ML based no-code analytics tool to slice and dice your data at all levels of granularity. It proactively surfaces statistically significant and meaningful insights about your KPIs. At a fraction of the cost of the standard BI tools, BoostKPI can not only alert you on an anomalous trend in any of your KPIs but will also tell you the root-cause behind it, “the what, why and where” behind any KPI change. Think of automatically being alerted to a slow rise in dead stock of loungewear primarily in fleece category, product type -pajamas, in sizes medium and large, originating in stores located in central California for the past 2 weeks – before this trend leads to huge COGS and profit shrinkage.
With a quick integration process, BoostKPI monitors any business KPI covering all contributing dimensions and attributes. It layers business rules and seasonality to filter dynamic trends, insights and anomalies within data segments. BoostKPI is a step beyond data visualizations, automatically surfacing intelligence behind your data - faster, better, and at a fraction of the cost of traditional tools.