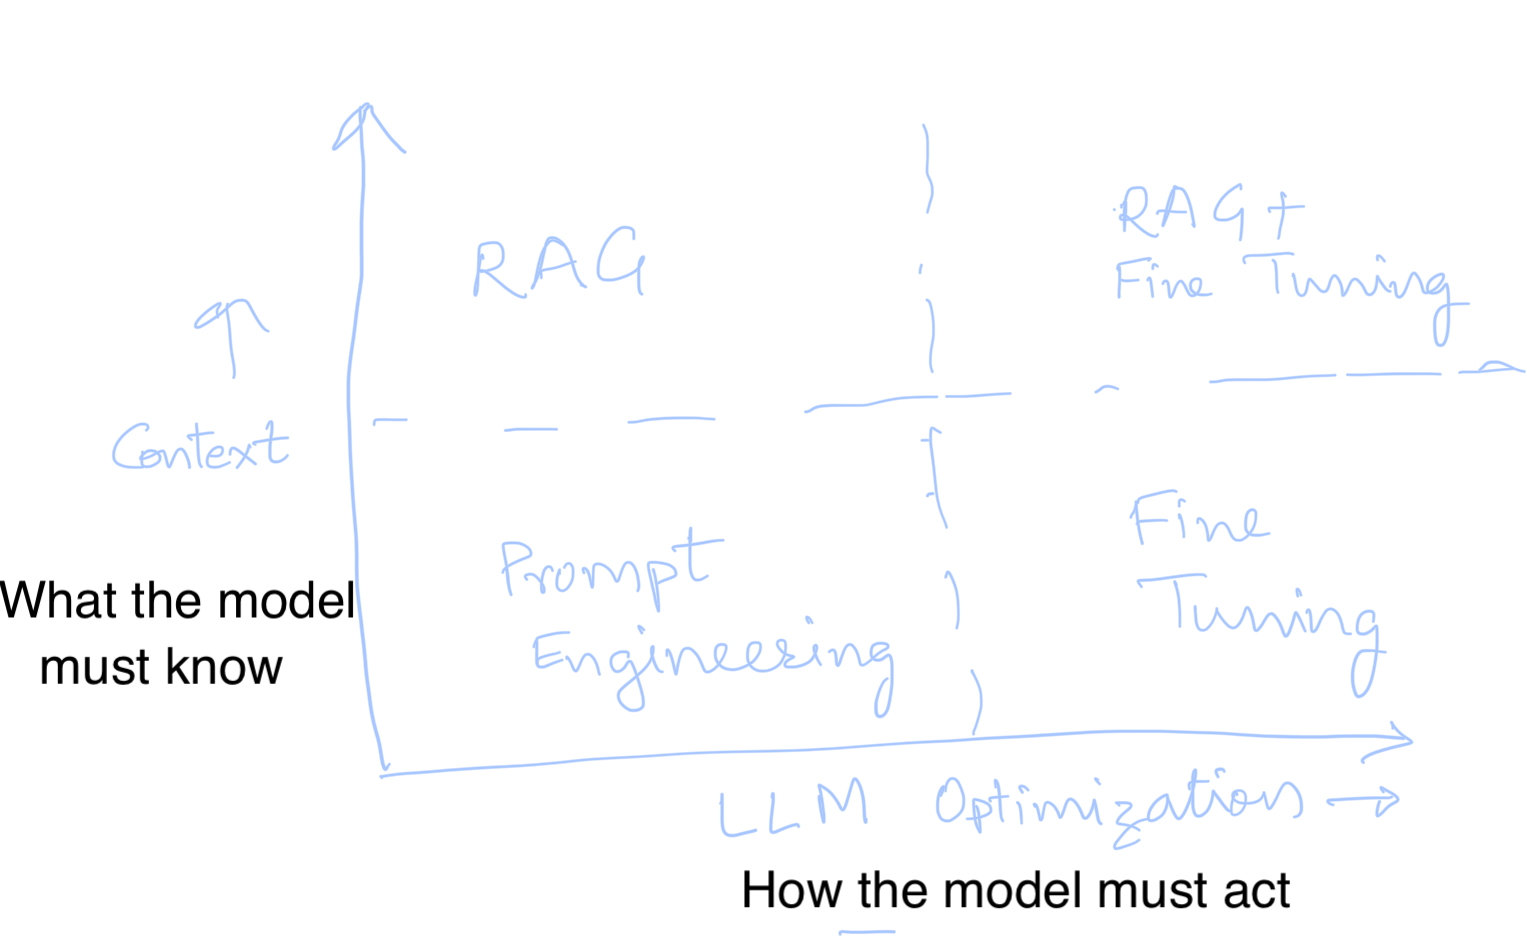
A Strategic Framework for Prompt Engineering and Beyond
A strategic framework on choosing amongst prompt engineering, RAG, and Fine Tuning.
The Evolution of SaaS: From Software-as-a-Service to Service-as-a-Software
Explore how transformative service can be delivered faster, better, and cheaper through AI-enabled software.

The AI-Powered Data Analyst: Revolutionizing Business Intelligence
Explore how a personalized AI powered data analyst democratizes data access for everyone
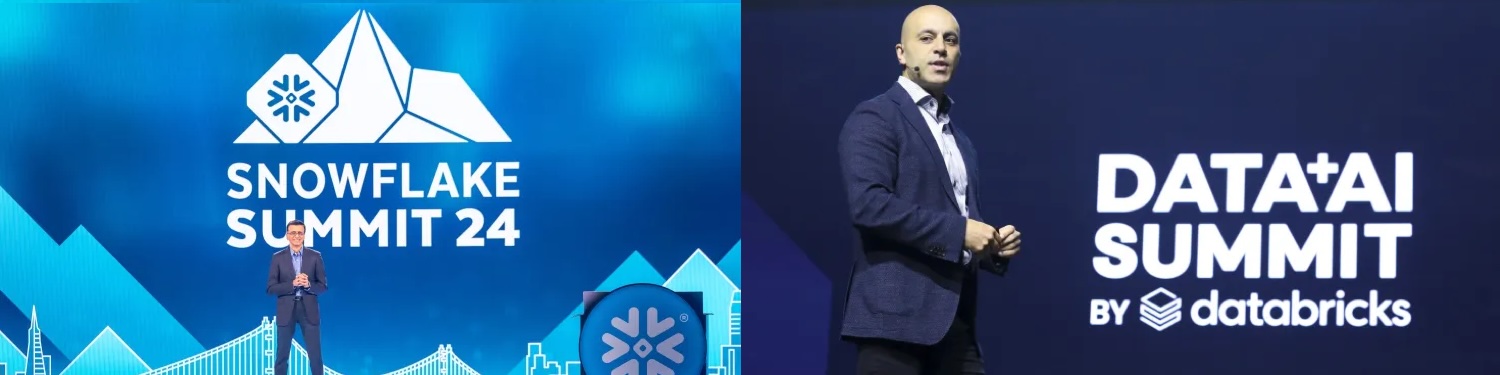
Snowflake and Databricks Summits 2024
Recap of the key themes and announcments from the Snowflake and Databricks summits in San Francisco.
The Evolution of Enterprise Data Systems
Explore how analytical databases have evolved from monoliths and how generative AI fits in.